Influence flower visualizes citation influences among academic entities, including papers, authors, institutions, and research topics.
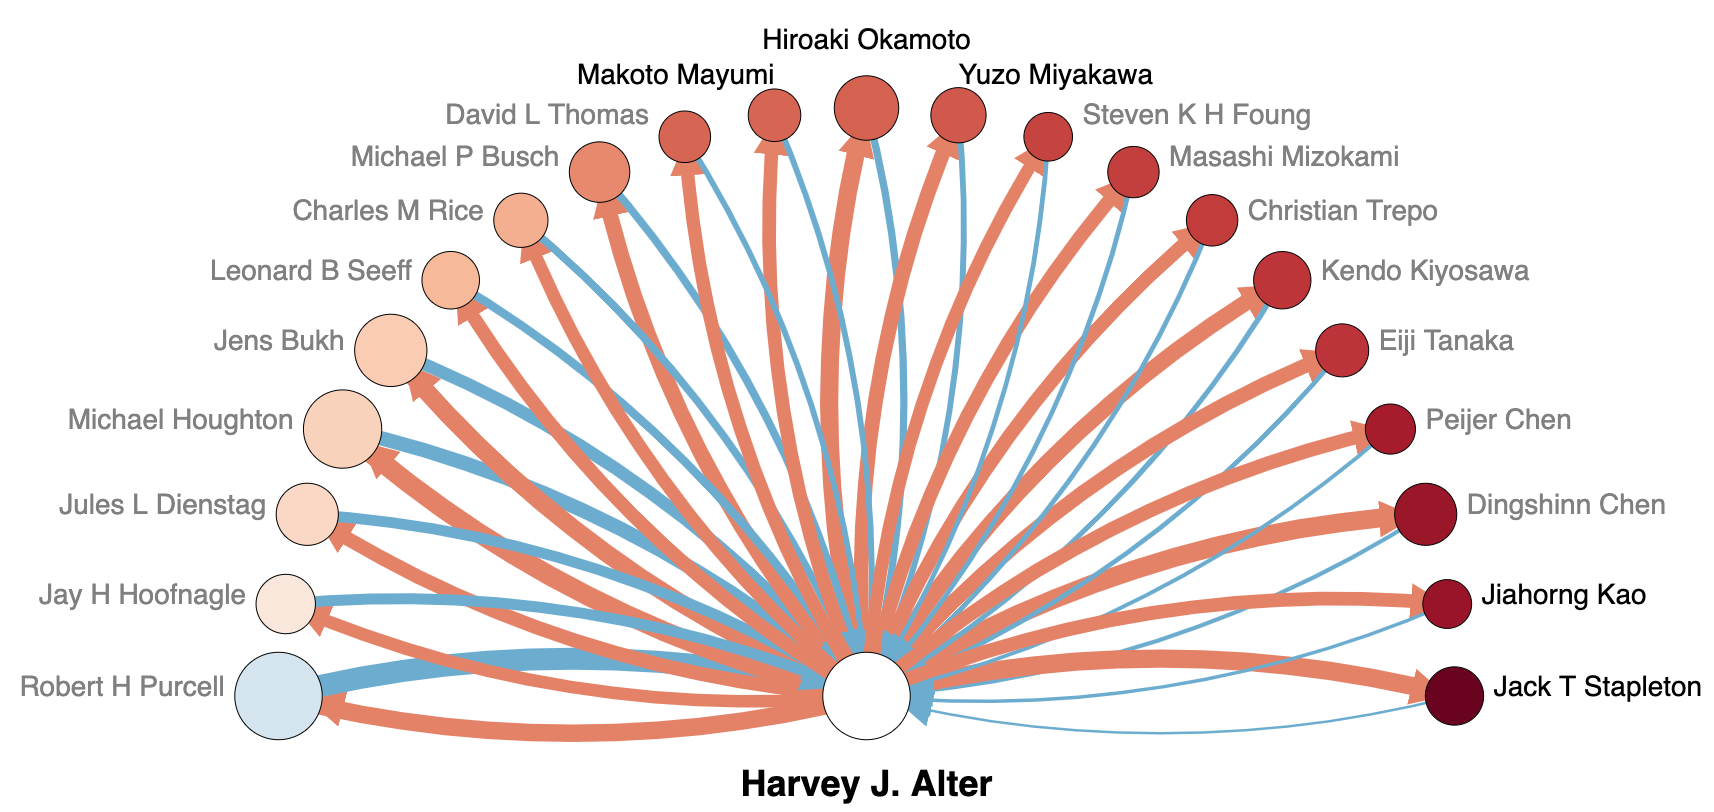
- Blue arcs denote incoming influence, with their thickness proportional to the number of references made.
- Red arcs denote outgoing influence, with their thickness proportional to the number of citations received.
- Node sizes and colors reflect the volume and composition of incoming and outgoing influence, see "Computing influence scores".
Computing influence scores
Influence scores is a function of paper citations.
 Each edge signifies the flow of influence to and from the center node (which could be a researcher, a publication venue, an insitution, or a research field),
the strength of this relation is reflected in the thickness of the edge.
Each edge signifies the flow of influence to and from the center node (which could be a researcher, a publication venue, an insitution, or a research field),
the strength of this relation is reflected in the thickness of the edge.
- The red edges denote the influence the center has towards the outer entities (which can be the same types), i.e., an outer entity citing a paper by the center. The blue edges denote the influence the outer entities have towards the center, i.e., the center cites a paper by an outer entity.
- The color of the outer nodes denotes the difference between incoming and outgoing influence scores. A blue node indicates that the associated entity has influenced the center more than the center has influenced itself. Likewise, a red node indicates the center has influenced the node's entity more than it has influenced the center.
- The size of the nodes reflect the total amount of incoming and outgoing influences it has with the center node.
We normalize the influence contribution by the number of entities in the cited paper, to prevent papers associated with a large number of entities (e.g. authors) from creating an overwhelming amount of influence.
Details about influence scores and normalisation choices can be found in Section 4.2 and Appendix B of the Influence Flower paper.Data source and profile
The current influence statistics are computed using the
OpenAlex dataset,
which contains comprehensive scientific publication records, citation relationships, as well as metadata about authors, institutions, journals, conferences, and fields of study.
The current InfluenceFlower is based on the OpenAlex 2025-05-30 release, replacing the previously used Microsoft Academic Graph (MAG), which was retired in December 2021.
In a nutshell, the whole dataset contains:
268 million scientific publications from as early as the 1800s.
103 million authors and 115 thousand institutions identified by OpenAlex.
65 thousand concepts (fields of study), such as "labour economics" and "algorithms".
2.64 billion citation links between publications.
The transition to OpenAlex offers access to an expanded dataset, enhancing the availability and accuracy of influence statistics.
However, some papers and authors may have missing data due to indexing delays or challenges with name entity resolution.
Additionally, scoring is based on a dataset snapshot, while entity names are retrieved directly from the OpenAlex API,
potentially causing occasional discrepancies between API results and scoring data.
Our team
Lead developer:Contributors:
- Jiahao Zhang
- Jakub Nabaglo
- Alexander Soen
- Benjamin Readshaw
ANU Computational Media Lab
Building 145, Science RdCollege of Engineering and Computer Science
The Australian National University
Canberra, ACT 2601, Australia
About the project
RepositoryReport Issue or Contact the Team